Viewing Data on a Web Site
 We can take your data and present it on the Web for both viewing and updating. This is a small demonstration of what we can do and uses some imaginary sales orders data we created. It is presented as read-only, but we can of course supply web pages that also support the adding, updating and deleting of data.
Clicking on this tab above will open the data grid that can be used to view, filter and sort a very large number of records quickly and easily.
Filter using pre-defined criteria
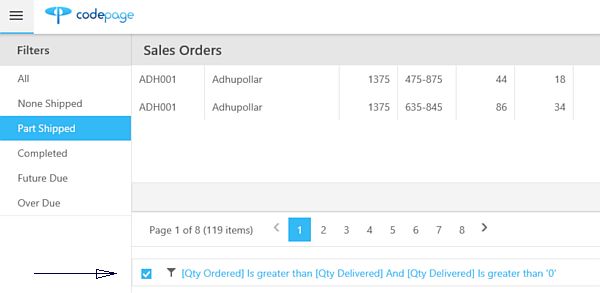 Along the left is a menu containing pre-defined filters. Click on these to see how the data in the grid changes. Look at the bottom of the grid and you will see the predefined criteria. For example, click "Part Shipped" to see the criteria is "Qty Ordered Is greater than Qty Delivered And Qty Delivered Is greater than '0'".
Find Values
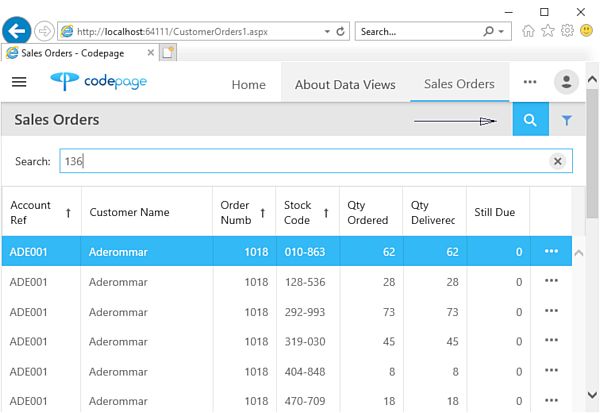 Looking at the top right, there is a magnifying glass icon, (under the "Dashboard" menu option). Clicking this will toggle a find dialogue. Type 136 into this then press "enter" and it will find all instances of this value in all of the data. In this case, it is found within order numbers, stock codes and even prices. Remove the text 136 then press enter to clear the search. Click the magnifying glass again to close the find dialogue.
Filter Values
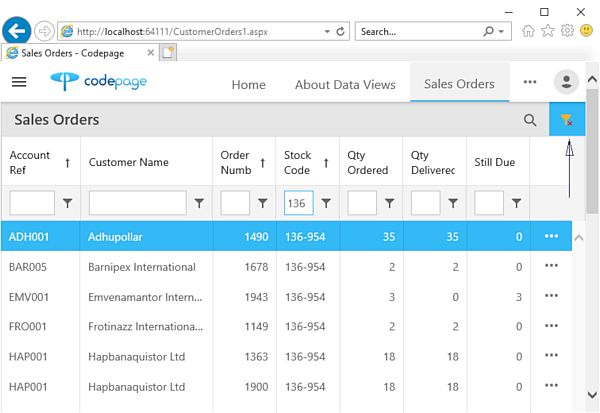 Looking at the top right again, there is a funnel icon, (under the "Dashboard" menu option). Clicking this will toggle a filter dialogue. Type 136 into this in the Stock Code Number column, then press "enter". This time it will only filter where stock codes begin with 136. Remove the text 136 then press enter to clear the search. Click the funnel icon again to close the filter dialogue.
To the right of each filter value box there is another funnel icon. Click on this to set the required rule. These change depending on whether the field is text or a number.
To sort data click in the column title. The first click will sort ascending, the second descending. To select an additional column, press and hold the shift key when clicking on the column.
Customers Form
This is a simple example of a form that would usually be used for maintaining customers.
Finding and displaying a customer
Either click in the Select Record box at the top, then scroll down, or type the first few letters of the customer to find.
Dashboards Form
These use the 10,000+ rows of sales order data to display costs and sell values based on optional criteria specified by the user.
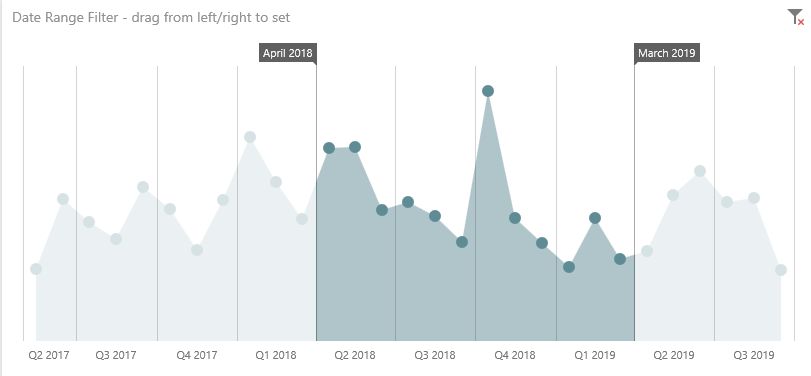
Sales Orders by Date Range
This displays the values of sales orders based on the date range selected by dragging the vertical bars left/right as needed.
Orders Customer Type and Dates
This displays the values of sales orders based on the customer type and optionally area and/or the date range selected. Further filtering is available by clicking on any of the cards:
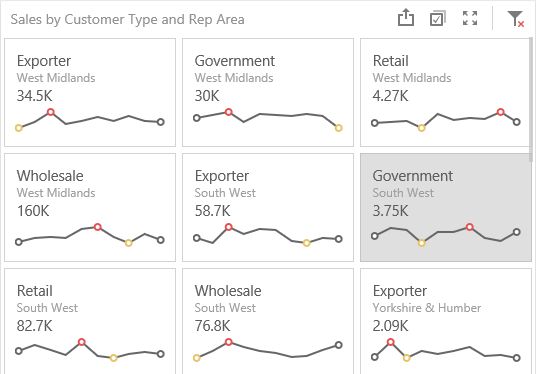
To clear the filter click on the funnel icon with the red X, at the top right of the card area.
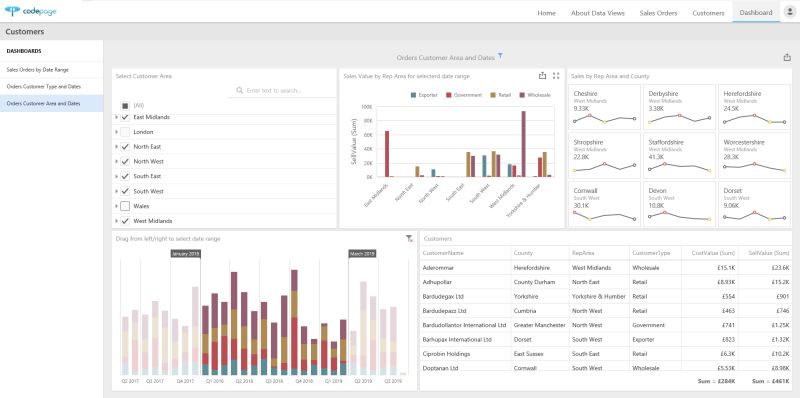
Orders Customer Area and Dates
This displays the values of sales orders based on the customer rep area and optionally county and/or the date range selected. As per above, further filtering is available by clicking on any of the cards.
To clear the filter click on the funnel icon with the red X, at the top right of the card area.
Pivot Table
Expand Summary Values
The Pivot table shows summary values by Rep Area when opened and these can be expanded to see each County and expanded again to see values by customers.
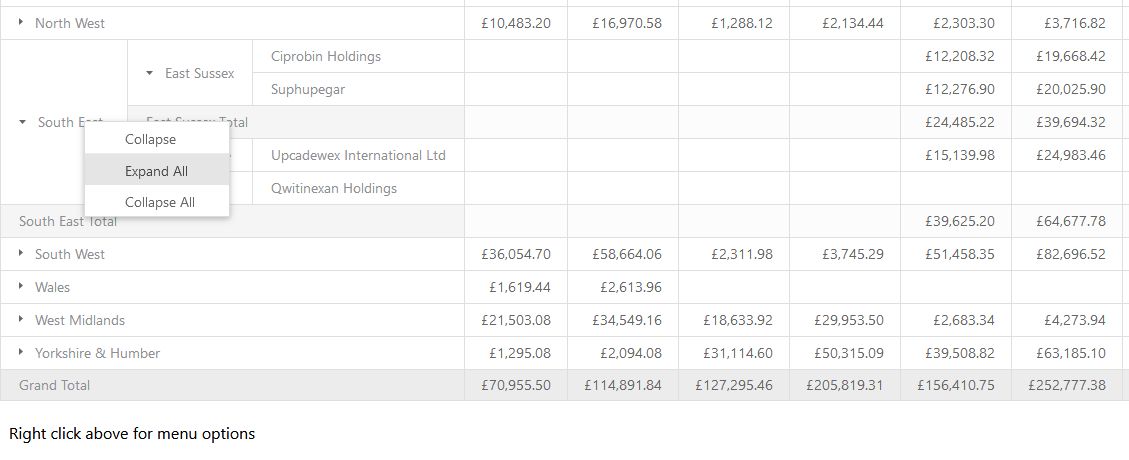
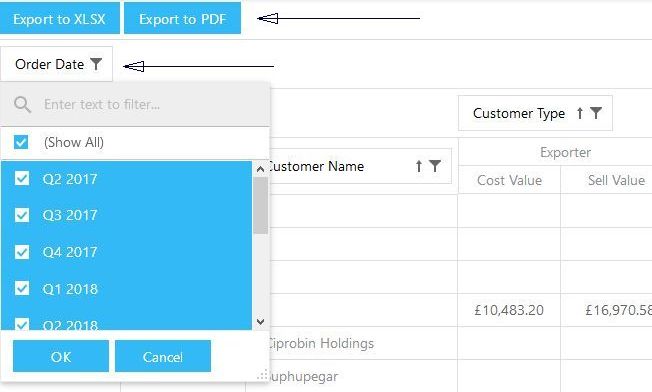
Export and Filter Data
There is a facility to export this screen to an Excel .xlsx file or an Adobe .pdf file. Below this, clicking on the funnel next to "Order Date" will allow the data to be filtered by the selected dates as required.